Abstract
Background: BCMA-targeted chimeric antigen receptor-engineered (anti-BCMA CAR) T-cell therapy has demonstrated favorable clinical outcomes in relapsed and refractory multiple myeloma (RRMM). Lymphodepleting (LD) chemotherapy including fludarabine (Flu) is hypothesized to promote expansion and persistence of CAR-T cells. Flu exhibits wide pharmacokinetic (PK) variability, with increased exposure as calculated by population PK model correlating with improved outcomes after anti-CD19+ CAR-T (Fabrizio VA, Blood Advances, 2022 & Dekker L. et al, Blood Advances, 2022).
Using clinical data from patients enrolled in the CARTITUDE-1 clinical trial (NCT03548207, N=97), a phase 1b/2 study assessing ciltacabtagene autoleucel (cilta-cel) in patients with RRMM, we hypothesized that the developed population PK model may predict outcomes after cilta-cel in myeloma.
Methods: Patients in the trial received a single cilta-cel infusion 5 to 7 days after fludarabine 30 mg/m2 and cyclophosphamide 300 mg/m2 for 3 consecutive days. Patients were excluded if they received any LD other than Flu/Cy or had any missing data needed to predict Flu exposure. Predicted exposure (pAUC) of Flu was determined by applying a population approach where eGFR is a covariate for Flu clearance and body weight is a covariate for Flu clearance and volume of distribution (Langenhorst JB, Clinical Pharmacokinetics, 2019). Individual Flu PK profiles and exposure metrics (Cmax, Ctrough and AUC0-72h) were simulated for each patient and were correlated with anti-BCMA CAR-T kinetics and efficacy (IMWG response, PFS and OS). Pearson/Spearman correlation coefficient was used to estimate the association between Flu PK parameters and LD effect, reflected by endogenous T cell changes (prior to versus post-LD), and CAR-T kinetics. Parametric t-test was used as the primary analysis and Mann-Whitney as the sensitivity analysis to determine if Flu AUC was associated with whether the patient can achieve stringent complete response (sCR) or not. PFS and OS rates were compared between 2 patient groups stratified by dichotomized LD exposure (AUC above and below the median).
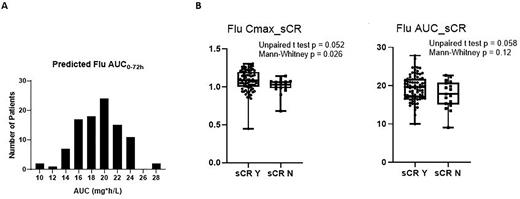
Results: We first investigated if there was variability in the two significant covariates of Flu PK in our cohort- body weight and eGFR. The eGFR distribution indicated large variability (mean=94.2, CV%=33.5) with 50 (51.5%) patients having renal dysfunction (eGFR <90 ml/min/1.73m2). Body weight ranged from 39 to 125.6 kg. The Flu pAUC in the entire population varied by 3.1-fold and the median was found to be 19.4 mg x h/L (IQR, 16.7-21.4; Figure 1A). No apparent association between Flu pAUC and CAR-T expansion and persistence was observed. Predicted peak Flu concentration (p=0.052) and AUC (p=0.058) appear to be slightly higher in sCR patients than non-sCR patients with significant overlapping (Figure 1B). Kaplan-Meier plot of PFS/OS (data cutoff: approximately 12 months of the last patient after CAR-T infusion) suggested no apparent association with LD exposure (p= 0.093 and 0.4 respectively). Analysis is ongoing to determine if there is an association between Flu pAUC and CRS/ICANS with results to be presented at the conference.
Conclusions: Although we did not measure Flu blood levels, we report for the first time the application of a previously published population PK model to simulate Flu exposure in a prospective cohort of myeloma patients undergoing anti-BCMA CAR-T therapy. Predicted peak Flu concentration and AUC appears to be slightly higher in sCR patients than non-sCR patients and there was no apparent correlation with CART kinetics or PFS/OS. Our data suggests a trend in Flu exposure predicting PFS but this needs to be further validated with additional data and analysis. Because the actual individual Flu exposure may deviate from the predicted population mean, a definitive analysis will require measurement of Flu blood levels prospectively with lymphodepletion to confirm potential relationships between Flu AUC, CART expansion & persistence, and CART clinical activity.
Figure 1. Distribution of Model-predicted Flu AUC0-72h (A). Boxplots of Peak Flu Concentration and Flu pAUC (B) with Stringent Complete Response. Boxplot shows the minimum, 25th quartile, median, 75th quartile, and maximum of the data. Symbols represent individual simulated data points in (B).
Disclosures
Patel:Exelixis: Current Employment. Schecter:Janssen: Current Employment, Current holder of stock options in a privately-held company. Wang:Janssen Research & Development: Current Employment. Madduri:Janssen: Current Employment; BMS, Takeda, GSK, Kinevant, Legend, Sanofi, Celgene: Consultancy; Amgen, Allogene, BMS, Celgene: Research Funding. Jackson:Janssen R&D: Current Employment. Zudaire:Janssen R&D, Johnson and Johnson: Current Employment. Yeh:Janssen R&D, LLC: Current Employment. Roccia:Janssen: Current Employment, Current equity holder in publicly-traded company. Geng:Legend Biotech USA: Current Employment. Pacaud:Legend Biotech USA: Current Employment. Sborov:BMS: Consultancy; Skyline Dx, Janssen, AbbVie, Sanofi: Consultancy; GlaxoSmithKline, Janssen: Consultancy, Membership on an entity's Board of Directors or advisory committees. Phelps:Alltrna: Consultancy; Wave Life Sciences: Consultancy. Hofmeister:GlaxoSmithKline: Membership on an entity's Board of Directors or advisory committees; BlueBird Bio: Honoraria; Genzyme: Membership on an entity's Board of Directors or advisory committees; Janssen: Membership on an entity's Board of Directors or advisory committees; Sanofi: Research Funding; Bristol Myers Squibb: Membership on an entity's Board of Directors or advisory committees, Research Funding.
Author notes
Asterisk with author names denotes non-ASH members.


This feature is available to Subscribers Only
Sign In or Create an Account Close Modal